
Inventory Redeployment through Optimized and Automated Recommendations
3AI November 3, 2022
Featured Article:
Author: Shrinath Bhat, Senior Data Scientist, AB InBev
Supply Chain of Future (SCoF) Analytics team’s vision, which is a part of Growth Analytics Centre (GAC): the global analytics hub for Ab-InBev, is to create value via adoption of cutting-edge practices in Supply Chain domain with a series of digital transformations and advanced analytics methodologies to keep the organizations focused on high-value tasks. We are transforming our company’s operations which has 200+ Breweries, 600+ Distribution Centers, 1000+ SKUs and 60+ Verticals. Overall, $25 B+ Industrial and Logistics Operating cost, where $5Bn+ is incurred in Logistics cost, $2.1Bn+ of expenses in Storage, $4.8Bn+ of inventory cost at any given time, $100Mn+ of Obsolescence and $1.7Bn+ of Out of Stock is recorded historically.
Inventory Re-Deployment Project
What is Inventory Re-deployment?
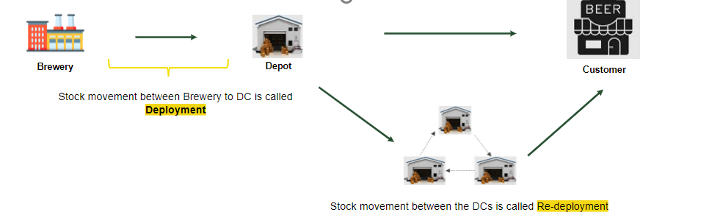
Before we jump on to understanding the redeployment process let’s revisit some basics.
There are three important constituents in any supply chain network. They are
- Place where goods are produced (Brewery)
- Intermediate storage or Distribution center
- Retailer or Customer
Inventory deployment is the movement of finished goods from locations “higher” in the supply network (like Brewery) to locations “lower” in the supply network (like Distribution Centers).
Inventory re-deployment is the movement of finished goods between Distribution Centers.
Below diagram explains the same:
Why do we need to redeploy?
We need redeployment to manage out of stock and obsolescence because of high demand volatility and ineffective demand planning.
The goal of the project is to improve stock availability to meet customer demand and service levels by optimizing the re-deployment of stock to maintain a balanced inventory across all the depots in a country
- Out of Stock can be defined as the unavailability of specific items or products at the point of purchase when the customer is ready to buy.
- Obsolescence can be defined as a product which is near to its expiry date or has reached its expiry date which needs to be written off or discarded
Key Issue in Logistics and Supply Chain:
- Inaccurate Demand Forecasting
- Stock Deployment Issues
- Stock planning
- Stock redeployment
- Production Issues
- Logistic Issues
Why is there a need to relook at the Re-deployment process?
There was a question asked by Logistics Capabilities Partners, “Is there a process to check re-deployment opportunities for the main risks of Obsolescence and Out of Stock with a clear view on cost implications?”
Answer to the question is no!
In the previous process:
- Manual analysis and recommendations were done which were time consuming and ad-hoc
- Mostly driven by either obsolescence or demand of the SKU
- Cost effectiveness of the stock movements were not considered
- Only top SKUs with either high obsolescence or high demand were considered for redeployment or transfers
We are hence trying to solve the above issues in the optimized process:
- Optimized and automated recommendations
- Driven by Fair Share (which is the concept of having a balanced inventory), Out of Stock and Obsolescence Stock
- Recommends the most cost-effective stock movements
- All SKUs are considered for redeployment
Data Landscape
There are various datafiles used in for the analytical data set preparation at DC-SKU (Distribution Center-Stock Keeping Unit) level which come from various data sources like SAP, Vertica, Tableau dashboard etc. and which can be majorly categorized into the following categories:
- Inventory and Orders data
With information on the opening stock, planned in volume, in-transit volume, planned production, average demand forecast, customer orders and re-order point
- Depot level data
With information on the location of the DCs, Trip cost involved for the redeployment etc.
- SKU level data
With information on the MACO without VLC, unit of measurement, stock age, out of stock etc.
The above-mentioned raw data is further preprocessed and transformed into the analytical data set.
There are 5 inputs to the optimization model:
- Details on the Source and Destination Distribution Centers which are decided based on the calculated stock on floor (in next 7 days), National Average of stock on floor and Re-Order Point
- In-risk of Obsolescence Stocks
- Out of Stock
- Trip Cost for redeployment
- MACO without VLC for calculating the profitability from the redeployment
Business Rules and Assumptions
There are various business rules and assumptions which are also an input to the optimization model as constraints. These rules and assumptions vary across countries and zones.
The following are a few of the rules and assumptions which need to be followed:
- The redeployment truck size and capacity (or the weight constraint).
- The total number of redeployments to be suggested by the model.
- The maximum number of trucks available to redeploy at source distribution center.
- The actual stock being redeployed must not be more than the total stock available to deploy at source and the total stock required to deploy at destination distribution centers
- Stock cannot be moved below the Reorder Point (The reorder point helps determine when to order new inventory. It is a specific point in time that acts as a trigger to re-order as soon as stock has diminished to that certain level) at source distribution centers during redeployment
- The SKUs or stocks that are considered for redeployment etc.
Optimization Model Solution Design
- The inputs to model help in identification of potential Distributions Centers and SKUs which can be considered for re-deployment.
- The optimization objective function is to “maximize profitability” (i.e., MACO benefit – Transport Cost) while moving SKU between DC’s, while adhering to the constraints from the business rules and assumptions.
- Optimizer iterates through selected options multiple times by trying different combinations of Distributions Centres, Quantity of redeployment load and SKUs to find optimal outcome which satisfies all constraints, prioritizing in risk of obsolescence stocks at the source DCs and OOS stocks at the destination DCs.
- The redeployment loads suggested by the model are validated by the Inventory Deployment Planning team and are executed by the team responsible for Redeployment; generally, the Tier-2 Logistics team who also oversee the deployment of stocks from distribution centers to the customers.
- The list of redeployment loads from the model are ranked as per benefits vs cost and the top suggestions which give us the maximum benefits vs cost are selected. The benefits vs costs are constituted of 4 components:
- MACO from obsolete vol re-deployed
- Destruction cost avoided due to obsolete vol re-deployed
- MACO from OOS prevented via redeployment
- Transport Cost incurred in redeployment
Inventory Redeployment Product
Key elements of Product framework are:
- Automated data pull
Data ecosystem is built with the data being extracted automatically from the data sources like SAP, Data Lake, Vertica etc.
- Automated model runs
Solution ecosystem is built with AI-powered seamless integration of the redeployment model, it’s performance report, root cause analysis and configurable scheduler.
- Interactive user interface for consuming model output
User ecosystem is built with manual automated trigger, integrated downstream platform and experiments tracking on the collaboration platform.
Summary
Imbalance of stock availability across depots is one of the major issues in supply chain and for solving it Inventory optimization model, an AI-powered linear optimization algorithm which recommends cost-optimized stock movements driven by out-of-stock and obsolescence has been developed, automating the earlier manual and inefficient processes. This solution will be implemented in 6 zones across 15 countries and has a potential opportunity of around $30Mn EBIDTA savings.