
Question Bank
Machine Learning Question Bank
What’s the trade-off between bias and variance?
More reading: Bias-Variance Tradeoff (Wikipedia)
Bias is error due to erroneous or overly simplistic assumptions in the learning algorithm you’re using. This can lead to the model underfitting your data, making it hard for it to have high predictive accuracy and for you to generalize your knowledge from the training set to the test set.
Variance is error due to too much complexity in the learning algorithm you’re using. This leads to the algorithm being highly sensitive to high degrees of variation in your training data, which can lead your model to overfit the data. You’ll be carrying too much noise from your training data for your model to be very useful for your test data.
The bias-variance decomposition essentially decomposes the learning error from any algorithm by adding the bias, the variance and a bit of irreducible error due to noise in the underlying dataset. Essentially, if you make the model more complex and add more variables, you’ll lose bias but gain some variance — in order to get the optimally reduced amount of error, you’ll have to tradeoff bias and variance. You don’t want either high bias or high variance in your model.
What is the difference between supervised and unsupervised machine learning?
More reading: What is the difference between supervised and unsupervised machine learning? (Quora)
Supervised learning requires training labeled data. For example, in order to do classification (a supervised learning task), you’ll need to first label the data you’ll use to train the model to classify data into your labeled groups. Unsupervised learning, in contrast, does not require labeling data explicitly.
How is KNN different from k-means clustering?
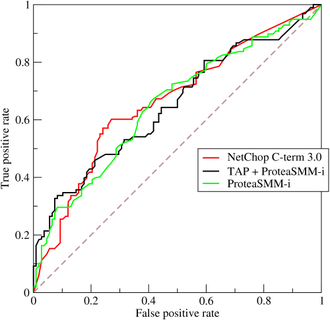
Explain how a ROC curve works.
More reading: Receiver operating characteristic (Wikipedia)
The ROC curve is a graphical representation of the contrast between true positive rates and the false positive rate at various thresholds. It’s often used as a proxy for the trade-off between the sensitivity of the model (true positives) vs the fall-out or the probability it will trigger a false alarm (false positives).
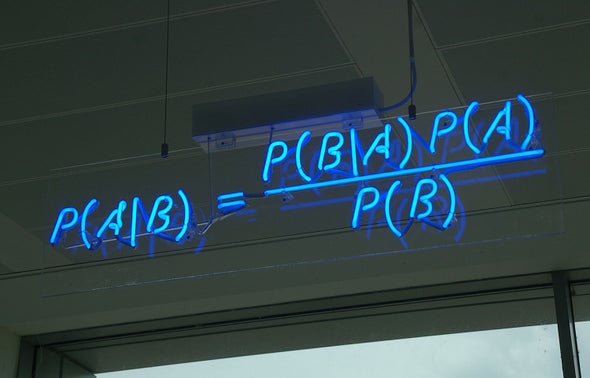
What is Bayes’ Theorem? How is it useful in a machine learning context?
More reading: An Intuitive (and Short) Explanation of Bayes’ Theorem (BetterExplained)
Bayes’ Theorem gives you the posterior probability of an event given what is known as prior knowledge. Mathematically, it’s expressed as the true positive rate of a condition sample divided by the sum of the false positive rate of the population and the true positive rate of a condition. Say you had a 60% chance of actually having the flu after a flu test, but out of people who had the flu, the test will be false 50% of the time, and the overall population only has a 5% chance of having the flu. Would you actually have a 60% chance of having the flu after having a positive test? Bayes’ Theorem says no. It says that you have a (.6 * 0.05) (True Positive Rate of a Condition Sample) / (.6*0.05)(True Positive Rate of a Condition Sample) + (.5*0.95) (False Positive Rate of a Population) = 0.0594 or 5.94% chance of getting a flu.
Bayes’ Theorem is the basis behind a branch of machine learning that most notably includes the Naive Bayes classifier. That’s something important to consider when you’re faced with machine learning interview questions.
Define precision and recall.
More reading: Precision and recall (Wikipedia)
Recall is also known as the true positive rate: the amount of positives your model claims compared to the actual number of positives there are throughout the data. Precision is also known as the positive predictive value, and it is a measure of the amount of accurate positives your model claims compared to the number of positives it actually claims. It can be easier to think of recall and precision in the context of a case where you’ve predicted that there were 10 apples and 5 oranges in a case of 10 apples. You’d have perfect recall (there are actually 10 apples, and you predicted there would be 10) but 66.7% precision because out of the 15 events you predicted, only 10 (the apples) are correct.
Why is “Naive” Bayes naive?
More reading: Why is “naive Bayes” naive? (Quora)
Despite its practical applications, especially in text mining, Naive Bayes is considered “Naive” because it makes an assumption that is virtually impossible to see in real-life data: the conditional probability is calculated as the pure product of the individual probabilities of components. This implies the absolute independence of features — a condition probably never met in real life.
As a Quora commenter put it whimsically, a Naive Bayes classifier that figured out that you liked pickles and ice cream would probably naively recommend you a pickle ice cream.
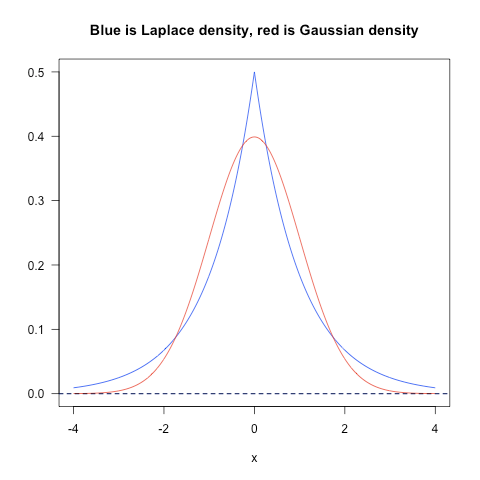
Explain the difference between L1 and L2 regularization ?
More reading: What is the difference between L1 and L2 regularization? (Quora)
L2 regularization tends to spread error among all the terms, while L1 is more binary/sparse, with many variables either being assigned a 1 or 0 in weighting. L1 corresponds to setting a Laplacean prior on the terms, while L2 corresponds to a Gaussian prior.
What’s your favorite algorithm, and can you explain it to me in less than a minute?
This type of question tests your understanding of how to communicate complex and technical nuances with poise and the ability to summarize quickly and efficiently. Make sure you have a choice and make sure you can explain different algorithms so simply and effectively that a five-year-old could grasp the basics!
What’s the difference between Type I and Type II error?
More reading: Type I and type II errors (Wikipedia)
Don’t think that this is a trick question! Many machine learning interview questions will be an attempt to lob basic questions at you just to make sure you’re on top of your game and you’ve prepared all of your bases.
Type I error is a false positive, while Type II error is a false negative. Briefly stated, Type I error means claiming something has happened
when it hasn’t, while Type II error means that you claim nothing is happening when in fact something is.
A clever way to think about this is to think of Type I error as telling a man he is pregnant, while Type II error means you tell a pregnant woman she isn’t carrying a baby.
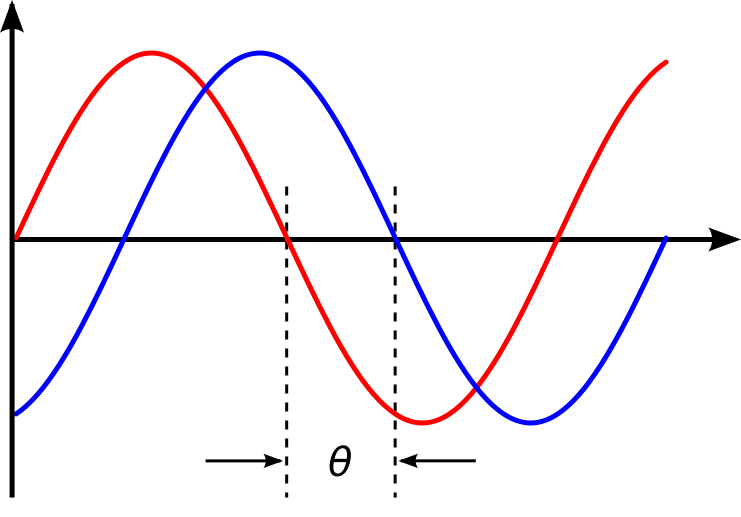
What’s a Fourier transform?
More reading: Fourier transform (Wikipedia)
A Fourier transform is a generic method to decompose generic functions into a superposition of symmetric functions. Or as this more intuitive tutorial puts it, given a smoothie, it’s how we find the recipe. The Fourier transform finds the set of cycle speeds, amplitudes and phases to match any time signal. A Fourier transform converts a signal from time to frequency domain — it’s a very common way to extract features from audio signals or other time series such as sensor data.
hat’s the difference between probability and likelihood?
What’s the difference between a generative and discriminative model?
More reading: Fourier transform (Wikipedia)
A Fourier transform is a generic method to decompose generic functions into a superposition of symmetric functions. Or as this more intuitive tutorial puts it, given a smoothie, it’s how we find the recipe. The Fourier transform finds the set of cycle speeds, amplitudes and phases to match any time signal. A Fourier transform converts a signal from time to frequency domain — it’s a very common way to extract features from audio signals or other time series such as sensor data.
What cross-validation technique would you use on a time series dataset?
More reading: Using k-fold cross-validation for time-series model selection (CrossValidated)
Instead of using standard k-folds cross-validation, you have to pay attention to the fact that a time series is not randomly distributed data — it is inherently ordered by chronological order. If a pattern emerges in later time periods, for example, your model may still pick up on it even if that effect doesn’t hold in earlier years!
You’ll want to do something like forward chaining where you’ll be able to model on past data then look at forward-facing data.
- fold 1 : training [1], test [2]
- fold 2 : training [1 2], test [3]
- fold 3 : training [1 2 3], test [4]
- fold 4 : training [1 2 3 4], test [5]
- fold 5 : training [1 2 3 4 5], test [6]
Machine learning interview questions: How is the decision tree pruned?
More reading: Pruning (decision trees)
Pruning is what happens in decision trees when branches that have weak predictive power are removed in order to reduce the complexity of the model and increase the predictive accuracy of a decision tree model. Pruning can happen bottom-up and top-down, with approaches such as reduced error pruning and cost complexity pruning.
Reduced error pruning is perhaps the simplest version: replace each node. If it doesn’t decrease predictive accuracy, keep it pruned. While simple, this heuristic actually comes pretty close to an approach that would optimise for maximum accuracy.
Which is more important to you– model accuracy, or model performance?
More reading: Accuracy paradox (Wikipedia)
This question tests your grasp of the nuances of machine learning model performance! Machine learning interview questions often look towards the details. There are models with higher accuracy that can perform worse in predictive power — how does that make sense? Well, it has everything to do with how model accuracy is only a subset of model performance, and at that, a sometimes misleading one. For example, if you wanted to detect fraud in a massive dataset with a sample of millions, a more accurate model would most likely predict no fraud at all if only a vast minority of cases were fraud. However, this would be useless for a predictive model — a model designed to find fraud that asserted there was no fraud at all! Questions like this help you demonstrate that you understand model accuracy isn’t the be-all and end-all of model performance.
What’s the F1 score? How would you use it?
More reading: F1 score (Wikipedia)
The F1 score is a measure of a model’s performance. It is a weighted average of the precision and recall of a model, with results tending to 1 being the best, and those tending to 0 being the worst. You would use it in classification tests where true negatives don’t matter much.
How would you handle an imbalanced dataset?
More reading: 8 Tactics to Combat Imbalanced Classes in Your Machine Learning Dataset (Machine Learning Mastery)
An imbalanced dataset is when you have, for example, a classification test and 90% of the data is in one class. That leads to problems: an accuracy of 90% can be skewed if you have no predictive power on the other category of data! Here are a few tactics to get over the hump:
- Collect more data to even the imbalances in the dataset.
- Resample the dataset to correct for imbalances.
- Try a different algorithm altogether on your dataset.
What’s important here is that you have a keen sense for what damage an unbalanced dataset can cause, and how to balance that.
When should you use classification over regression?
More reading: Regression vs Classification (Math StackExchange)
Classification produces discrete values and dataset to strict categories, while regression gives you continuous results that allow you to better distinguish differences between individual points. You would use classification over regression if you wanted your results to reflect the belongingness of data points in your dataset to certain explicit categories (ex: If you wanted to know whether a name was male or female rather than just how correlated they were with male and female names.)
Name an example where ensemble techniques might be useful
More reading: Ensemble learning (Wikipedia)
Ensemble techniques use a combination of learning algorithms to optimise better predictive performance. They typically reduce overfitting in models and make the model more robust (unlikely to be influenced by small changes in the training data).
You could list some examples of ensemble methods, from bagging to boosting to a “bucket of models” method and demonstrate how they could increase predictive power.
How do you ensure you’re not overfitting with a model?
More reading: How can I avoid overfitting? (Quora)
This is a simple restatement of a fundamental problem in machine learning: the possibility of overfitting training data and carrying the noise of that data through to the test set, thereby providing inaccurate generalisations.
There are three main methods to avoid overfitting:
- Keep the model simpler: reduce variance by taking into account fewer variables and parameters, thereby removing some of the noise in the training data.
- Use cross-validation techniques such as k-folds cross-validation.
- Use regularization techniques such as LASSO that penalise certain model parameters if they’re likely to cause overfitting.
What evaluation approaches would you work to gauge the effectiveness of a machine learning model?
More reading: How to Evaluate Machine Learning Algorithms (Machine Learning Mastery)
You would first split the dataset into training and test sets, or perhaps use cross-validation techniques to further segment the dataset into composite sets of training and test sets within the data. You should then implement a choice selection of performance metrics: here is a fairly comprehensive list. You could use measures such as the F1 score, the accuracy, and the confusion matrix. What’s important here is to demonstrate that you understand the nuances of how a model is measured and how to choose the right performance measures for the right situations.
How would you evaluate a logistic regression model?
More reading: Evaluating a logistic regression (CrossValidated), Logistic Regression in Plain English
A subsection of the question above. You have to demonstrate an understanding of what the typical goals of a logistic regression are (classification, prediction, etc.) and bring up a few examples and use cases.
Machine learning interview questions: What’s the “kernel trick” and how is it useful?
More reading: Kernel method (Wikipedia)
The Kernel trick involves kernel functions that can enable in higher-dimension spaces without explicitly calculating the coordinates of points within that dimension: instead, kernel functions compute the inner products between the images of all pairs of data in a feature space. This allows them the very useful attribute of calculating the coordinates of higher dimensions while being computationally cheaper than the explicit calculation of said coordinates. Many algorithms can be expressed in terms of inner products. Using the kernel trick enables us to effectively run algorithms in a high-dimensional space with lower-dimensional data.
How do you handle missing or corrupted data in a dataset?
More reading: Handling missing data (O’Reilly)
You could find missing/corrupted data in a dataset and either drop those rows or columns or decide to replace them with another value. In Pandas, there are two very useful methods: isnull() and dropna() that will help you find columns of data with missing or corrupted data and drop those values. If you want to fill the invalid values with a placeholder value (for example, 0), you could use the fillna() method. The action would be based depending upon the pattern of missing or corrupt data. Possible options are
- Delete rows with missing values, check if missing is completely at random and percentage of missing values is low
- Recover the values by contacting the participants for sourcing the missing data
- Use the average value, if there is not much variability in the data
- Use a more structured guess with a common point imputation
- Use multiple regression analysis to predict the missing value from other values
- Use correlations between data with multiple imputations. Plausible values are created, based on the correlations for the missing data and the simulated datasets averaged by incorporating random errors in the predictions.
- Assign a unique category, when we want to prevent loss of data
- Predict missing values using linear regression
- Use algorithms that support missing values, like KNN, random forest or a tree-based method
Do you have experience with Spark or big data tools for machine learning?
More reading: Handling missing
More reading: 50 Top Open Source Tools for Big Data (Datamation)
This is a tricky question that calls for a forthright answer. To begin with, make sure to be familiar with big data and the tools used. Talk about Spark only if you know it, and limit your answer to your extent of knowledge.
You’ll want to get familiar with the meaning of big data for different companies and the different tools they’ll want. Read on to prepare your answer on Spark-
Spark is the most popular big data tool because of its ability to handle large datasets with speed. It supports in-memory parallel computing, is open-source and compatible with Hadoop. It works well in an IoT network and has a vast range of tools to work with, like machine learning, interactive SQL and real-time processing, that helps analyse real-time streaming data at high speed. Be honest if you don’t have experience with the tools demanded, but also take a look at job descriptions and see what tools pop up, you’ll want to invest in familiarising yourself with them.
Explain SVM and why it is called as maximum margin classifier
Support Vector Machine (SVM) is a supervised machine learning algorithm, used for both, classification and regression. It sorts the data into one of two categories and outputs a map of the sorted data with the margins between the two data points as far apart as possible.
It is known as maximum margin classifier because in a binary classification dataset, it places the decision boundary such that the distance between the two clusters is maximised. The SVM aims to find a separating hyperplane between positive and negative instances. It establishes the largest margin to avoid overfitting.
Pick an algorithm. Write the pseudo-code for a parallel implementation
More reading: Writing pseudocode for parallel programming (Stack Overflow)
This kind of question demonstrates your ability to think in parallelism and how you could handle concurrency in programming implementations dealing with big data. Take a look at pseudocode frameworks such as Peril-L and visualisation tools such as Web Sequence Diagrams to help you demonstrate your ability to write code that reflects parallelism.
What are some differences between a linked list and an array?
More reading: Array versus linked list (Stack Overflow)
An array is an ordered collection of objects. A linked list is a series of objects with pointers that direct how to process them sequentially. An array assumes that every element has the same size, unlike the linked list. A linked list can more easily grow organically whereas an array has to be pre-defined or re-defined for organic growth. Shuffling a linked list involves changing which points direct where meanwhile, shuffling an array is more complex and takes more memory.
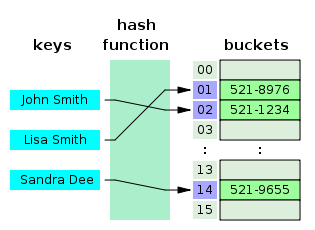
Machine learning interview questions: Describe a hash table
More reading: Hash table (Wikipedia)
A hash table is a data structure that produces an associative array. A key is mapped to certain values through the use of a hash function. They are often used for tasks such as database indexing.
Which data visualisation libraries do you use? What are your thoughts on the best data visualisation tools?
More reading: Why every Data Aspirant Should Learn Data Visualization? (Springboard Blog)
What’s important here is to define your views on how to properly visualise data and your personal preferences when it comes to tools. Popular tools include R’s ggplot, Python’s seaborn and MatplotLib, and tools such as Plot.ly and Tableau.
Related: Top 6 Python Libraries for AI and Machine Learning (Springboard Blog)
Python Programming Language: Everything You Need to Know (Springboard Blog)
Top 8 Python Frameworks (Springboard Blog)
How would you implement a recommendation system for our company’s users?
More reading: How to Implement A Recommendation System? (Stack Overflow)
A lot of machine learning interview questions of this type will involve the implementation of machine learning models to a company’s problems. You’ll have to research the company and its industry in-depth, especially the revenue drivers the company has, and the types of users the company takes on in the context of the industry it’s in.
How can we use your machine learning skills to generate revenue?
More reading: Startup Metrics for Startups (500 Startups)
This is a tricky question. The ideal answer would demonstrate knowledge of what drives the business and how your skills could relate. For example, if you were interviewing for music-streaming startup Spotify, you could remark that your skills at developing a better recommendation model would increase user retention, which would then increase revenue in the long run.
The startup metrics Slideshare linked above will help you understand exactly what performance indicators are important for startups and tech companies as they think about revenue and growth.
How do you choose an algorithm for a classification problem?
There is no one solution fits all. Several factors go into the choice of a machine learning algorithm. The choice depends upon the level of accuracy required, and the size of the training set. Here is a sample answer.
The method followed would be:
a) Define the problem.
Herein, the output of the model is a class, as it is a classification problem.
b) Identify available algorithms from linear and non-linear classifiers
- Logistic Regression.
- Linear Discriminant Analysis
- k-Nearest Neighbours.
- Classification and Regression Trees.
- Naive Bayes.
- Support Vector Machines.
c) Implement all of them.
Next, set up a machine learning pipeline that compares the performance of each algorithm on the dataset, using a set of evaluation criteria or chosen metrics. The best performing one would be selected. Depending upon the results, either it would be run once or in intervals when new data is added.
d) Improve results using various optimisation methods
By using cross-validation (like k-fold) and hyperparameter tuning or Ensembling (bagging, boosting, etc); each algorithm would be tuned to optimise performance if time is not a constraint. Otherwise, manually select the hyperparameters.
Machine learning interview questions: What do you think of our current data process?
This kind of question requires you to listen carefully and impart feedback in a manner that is constructive and insightful. Your interviewer is trying to gauge if you’d be a valuable member of their team and whether you grasp the nuances of why certain things are set the way they are in the company’s data process based on a company- or industry-specific conditions. They’re trying to see if you can be an intellectual peer. Act accordingly.
What are the last machine learning papers you’ve read?
More reading: What are some of the best research papers/books for machine learning?
Keeping up with the latest scientific literature on machine learning is a must if you want to demonstrate an interest in a machine learning position. This overview of deep learning in Nature by the scions of deep learning themselves (from Hinton to Bengio to LeCun) can be a good reference paper and an overview of what’s happening in deep learning — and the kind of paper you might want to cite.
Do you have research experience in machine learning?
Related to the last point, most organisations hiring for machine learning positions will look for your formal experience in the field. Research papers, co-authored or supervised by leaders in the field, can make the difference between you being hired and not. Make sure you have a summary of your research experience and papers ready — and an explanation for your background and lack of formal research experience if you don’t.
What are your favourite use cases of machine learning models?
More reading: What are the typical use cases for different machine learning algorithms? (Quora)
The Quora thread above contains some examples, such as decision trees that categorise people into different tiers of intelligence based on IQ scores. Make sure that you have a few examples in mind and describe what resonated with you. It’s important that you demonstrate an interest in how machine learning is implemented.
How would you approach the “Netflix Prize” competition?
More reading: Netflix Prize (Wikipedia)
The Netflix Prize was a famed competition where Netflix offered $1,000,000 for a better collaborative filtering algorithm. The team that won called BellKor had a 10% improvement and used an ensemble of different methods to win. Some familiarity with the case and its solution will help demonstrate you’ve paid attention to machine learning for a while.
Machine learning interview questions: Where do you usually source datasets?
More reading: Top Data Science Datasets and Ideas for Machine Learning and Analytics Projects (Springboard Blog)
Machine learning interview questions like these try to get at the heart of your machine learning interest. Somebody who is truly passionate about machine learning will have gone off and done side projects on their own, and have a good idea of what great datasets are out there. If you’re missing any, check out Quandl for economic and financial data, and Kaggle’s Datasets collection for another great list.
How do you think Google is training data for self-driving cars?
More reading: Waymo Tech
Machine learning interview questions like this one really test your knowledge of different machine learning methods, and your inventiveness if you don’t know the answer. Google is currently using recaptcha to source labelled data on storefronts and traffic signs. They are also building on training data collected by Sebastian Thrun at GoogleX — some of which was obtained by his grad students driving buggies on desert dunes!
How would you simulate the approach AlphaGo took to beat Lee Sidol at Go?
More reading: Mastering the game of Go with deep neural networks and tree search (Nature)
AlphaGo beating Lee Sidol, the best human player at Go, in a best-of-five series was a truly seminal event in the history of machine learning and deep learning. The Nature paper above describes how this was accomplished with “Monte-Carlo tree search with deep neural networks that have been trained by supervised learning, from human expert games, and by reinforcement learning from games of self-play.”
Trending 3AI Articles
-
A Framework for Analytics & AI Value Realization

We’re living in times of a great data paradox. One side of the paradox is the explosive growth of data in and around us. Here are some facts reported in IDC’s Global Data Sphere to corroborate this:– 59 Zettabytes – total volume of data processed in the year 2020– 26% CAGR – the forecasted growth […]
-
Unlocking HR Potential: The Transformative Benefits of Generative AI in Human Resources

Featured Article: Author: Vipin Verma, Orange Business Services Introduction to Generative AI in Human Resources Human Resources (HR) is a critical function in any organization, responsible for managing and developing the most valuable asset: the workforce. With the advancements in technology, particularly in the field of Artificial Intelligence (AI), HR has the opportunity to unlock […]
-
Upskilling into AI

Featured Article: Author: Puneeth B C, Computer Vision Specialist, Airbus India AI has penetrated our lives in a way that sometimes we don’t even realize. Devices and applications we use, are becoming smarter every day. An AI system knows more than what we know of ourselves. It is faster and more accurate than us in […]
-
Understanding Language Model Evaluation Metrics: A Comprehensive Overview

Featured Article: Author: Mradul Jain, AB InBev Large language models, such as GPT, Llama, Bard, etc. have gained immense popularity for their ability to generate coherent and contextually relevant text. Evaluating the performance of these models is crucial to ensure their reliability and utility. To accomplish this, a range of metrics have been developed. In […]