
Automated Quality Excellence Framework for Data Science Modelling
3AI August 17, 2023

Featured Article:
Author: Abhishek Sengupta, Walmart Global Tech India
Introduction:
A necessary but often tedious task data scientists must perform as part of any project is quality assurance (QA) of their modules so as to prevent any unforeseen incidents during deployment. While Quality Assurance and Excellence is quite prevalent in Data Engineering, QE in Data Science world is still in an evolving state and is not always automated. For many reasons, it is neither possible nor desirable to completely automate QA. For example, thorough QA typically involves leveraging a degree of domain expertise which is not easily encoded in a computer program. However, we can still be freed of some of the tedium of QA. In this article, we illustrate a way to mix automation with interactivity to reduce the manual steps in QA without compromising the data scientist’s ability to do that which is best done manually.
Quality in Data Science
We break down this article into the below themes:
- First, we look at the overall Data Science Architecture and different artifacts generated at each step
- Next, we focus on a couple of artifacts and try to understand what all DQ checks are relevant for these Artifacts
- Finally, we try to create an automated process of ensuring these DQ checks through code snippets and examples
Starting off with the Data Science Architecture, the below diagram shows a generic Data Science Flow and its key components:
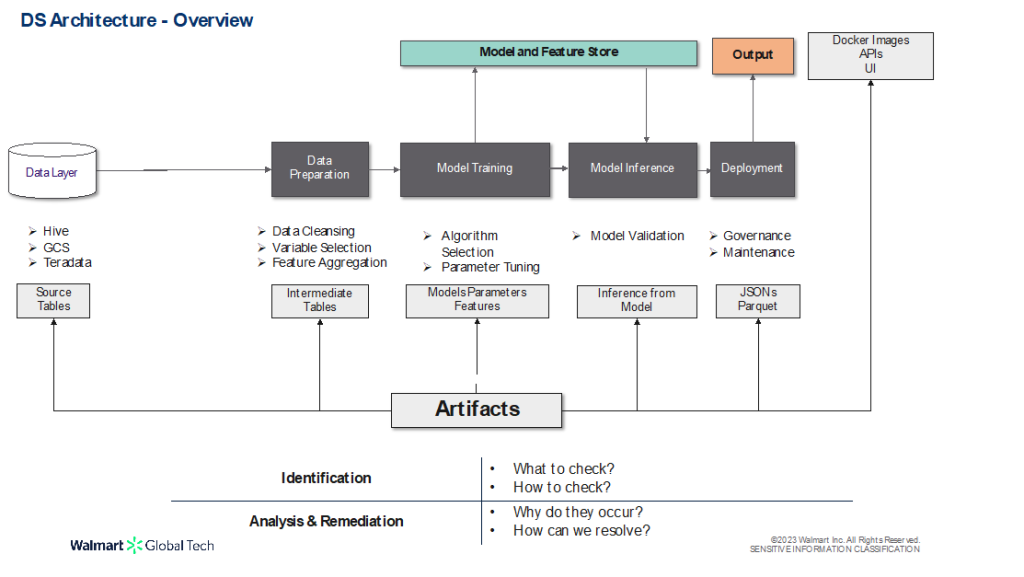
- Data Layer – where the Source Data resides
- Data Preparation – where the data is cleaned & aggregated, appropriate features are selected for the task at hand, etc.
- Model Training – the crux of the Data Science pipeline wherein the relevant algorithms are trained and hyper-tuned to achieve the best performance metrics
- Model Inference – deals with validating the trained models with out-of-sample data
- Deployment Phase – where the final model output into production – which can be exposed via APIs, Docker Images, etc.
Each of these phases produce certain Artifacts as illustrated above. Our goal is to ensure and enhance quality of each of these artifacts by:
- Identifying what all to check for and how to check them
- Upon identification of the defect(s), analysing the root cause and strategizing ways of remediation
Before diving into the QC Part, let us first familiarize ourselves with 6 key dimensions of data quality which are applicable for most data sources:
- Completeness: Data is considered “complete” when it fulfills expectations of comprehensiveness. Data is complete when all the necessary data is available. This doesn’t necessarily mean that all the data fields must get filled out—only that are critical do. A common example is checking for missing values in a column or table; wherein completeness can be measured as below:
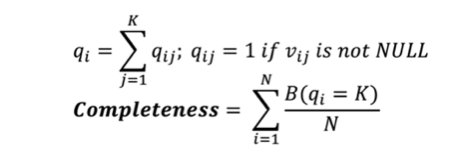
where,
- B = 1 if condition is met, else 0
- vij = value at col. j and row i
- N = Total no of rows/records
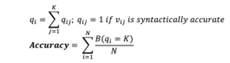
Accuracy: Refers to the degree to which information accurately reflects an event or object described. It can be measured as closeness of the value v to the accepted values in a specific domain:
- Timeliness: Indicates if the required information is available right when it’s needed. Can be measured as a freshness indicator of the data for a specific application:
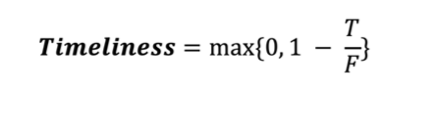
where,
- T: Age of the data
- F :Frequency of the data.
- Consistency/Compliance: Indicates whether all data instances are not violating constraints across multiple data sets. It improves the ability to link data from multiple sources and thus increases the usability of the data. One such example can be checking for constraint violation between two columns and can be measured as:
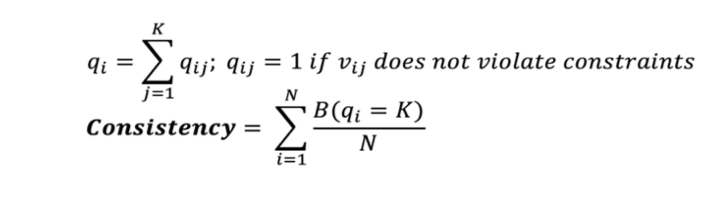
- Uniqueness: Measures if there is data duplication in the records:
Having understood the various dimensions for data quality, the idea is to pass all data tables through tests which provide a score on each of these data dimensions, with additional tests augmenting these tests to provide more nuanced reports. Each of these tests will have a predefined set of thresholds, and if the quality falls below a certain threshold, automated warnings will be triggered.
Let’s illustrate the above with an example. Consider the below table containing the sales and starting inventory for an item for the latest week:
| Week No. | Catg_Number | Item_Number | Sales | Start_Inventory |
| 202244 | 12529 | 172231934 | 100 | 230 |
| 202245 | NULL | 172231934 | 158 | 210 |
| 202245 | 12529 | 172231923 | 123 | 150 |
| 202245 | 12529 | 17 | 100 | 50 |
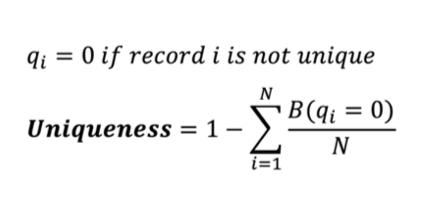
Though there are multiple libraries which perform automated DQ checks, we lean towards PyDeequ [1], a Python API for Deequ, a library built on top of Apache Spark, mainly for its ability to handle scale and ease of integration into PySpark. PyDeequ provides a wide variety of Analyzers (https://pydeequ.readthedocs.io/en/latest/pydeequ.html#module-pydeequ.analyzers), which computes metrics for data profiling and validation at scale.
Below is a sample DQ Check on some of the columns for the above dataset using PySpark:
The code snippet tests for the below:
- Is the Catg_Number column complete?
- Is there Compliance between Sales and Starting Inventory (Inventory should be greater than sales)
- Are the values of Item_number accurate?
- Is the Itenm_number column unique?
- Is the Week column up to date?
The result is as follows:
| entity | instance | name | value |
| Column | Catg_Number | Completeness | 0.75 |
| Column | Sales | Compliance | 0.75 |
| Column | Item_Number | Compliance | 0.75 |
| Column | Week | Compliance | 0.75 |
| Column | Item_Number | Uniqueness | 0.75 |
Note that PyDeequ does not have Analyzers specific to Accuracy and Timeliness, but user-defined compliance Analyzers can be used to serve the same purpose.
The next step is to set warning thresholds for each of these tests (each row), with alerts being trigged if the “value” falls below the set threshold.
| entity | instance | name | value | threshold | warning_flag |
| Column | Catg_Number | Completeness | 0.75 | 0.8 | 1 |
| Column | Sales | Compliance | 0.75 | 1 | 1 |
| Column | Item_Number | Compliance | 0.75 | 0.5 | 0 |
| Column | Week | Compliance | 0.75 | 1 | 1 |
| Column | Item_Number | Uniqueness | 0.75 | 0.7 | 0 |
Apart from these metrics, additional QA checks can also be performed based on additional constraints such as:
- Business Requirements (expose values only beyond a certain threshold)
- Domain Knowledge (non-negative p-values)
These tests can be performed similarly using the Compliance Analyzer from PyDeequ.
The other type of data DQ Checks that can be performed are Model Data Checks, which are specific to datasets which act as outputs of a Data Science Model. These can be categorized into the two below buckets:
- Pre-Train Tests: (This tests are performed before model parameter tuning)
- Shape Consistency: Check for output dimensions at each stage
- Data Format Consistency: Checks for correct Data Formats
- Data Leakage Checks: No training for future data /testing on past data
- Post-Train Tests (This tests are performed post model parameter tuning):
- Invariance Tests: Model Consistency checks by tweaking one feature (E.g. changing gender should not affect individual’s eligibility for loan)
- Directional Expectations: Directional stability between Predictor Coefficients and Response (E.g. having a higher credit score should increase loan eligibility)
Let’s illustrate this with another dataset, which contains the medical insurance “charges” for a set of persons with differing features. The goal is to predict the “charges” for a new person with known features. Below is a sample from the data:
| age | sex | bmi | children | smoker | region | age_range | have_children | charges |
| 31 | 0 | 23.6 | 2 | 0 | 3 | 2 | 1 | 4931.64 |
| 44 | 0 | 38.06 | 0 | 1 | 2 | 3 | 0 | 48885.13 |
| 58 | 1 | 49.06 | 0 | 0 | 2 | 4 | 0 | 11381.32 |
| 27 | 1 | 29.15 | 0 | 1 | 2 | 1 | 0 | 18246.49 |
| 33 | 0 | 32.9 | 2 | 0 | 3 | 2 | 1 | 5375.03 |
| 24 | 1 | 32.7 | 0 | 1 | 3 | 1 | 0 | 34472.84 |
| 33 | 1 | 27.1 | 1 | 1 | 3 | 2 | 1 | 19040.87 |
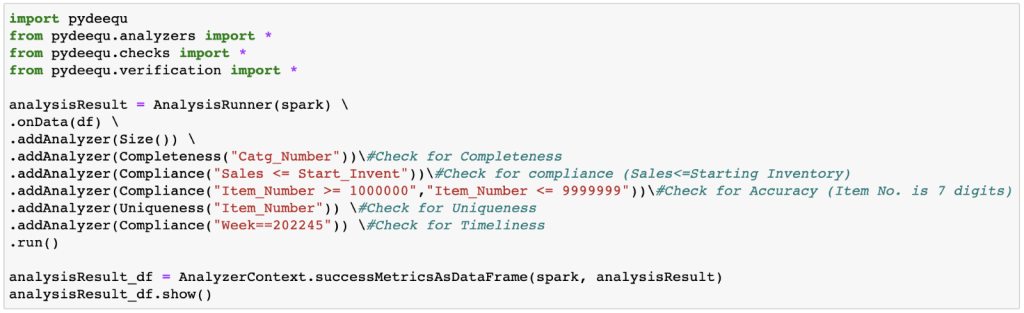
For performing the model DQ Checks, we will take the help of PyTest, a Python Library for writing small, readable tests, which can scale to support complex functional testing for applications and libraries. Note that this can also be used in PySpark via Pandas UDFs.
The above example shows pre_train tests for data shape and leakage checks using PyTest [2]. We have excluded user-defined functions like data_preparation, etc. for the sake of brevity. Also note that, instead of assert, we have pytest_check. It acts as a soft assert meaning that even if an assertion fails in between, the test will not stop there but instead proceed till completion and report all the assertion fails.
Post-train tests can be similarly defined using PyTest once the possible tests are identified. For our example, we shall check for sex invariance in the post-train test script. Ideally, the charges should not vary according to the gender of the individual applying for insurance. Let’s test for it by writing this test script.
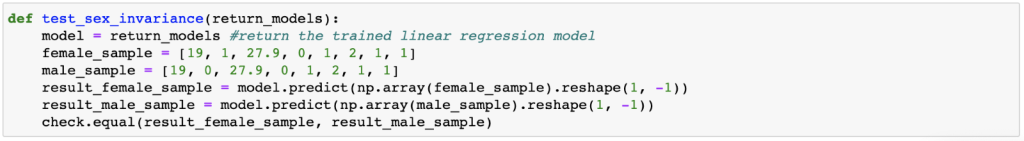
In the above test script, we define two data points one with sex as “female” and the other with sex as “male” with all other values being equal. Now, we predict the charges using the model and check whether the charges are equal or not. Similar tests can be conducted for other features as well.
Data Fairness is also a big concern in Data Science which ensures that we use data in a way that doesn’t create or reinforce bias. Our society is full of biases, and some can be positive and improve the way we act towards others. Some biases are often unconscious and can often be replicated to software or program. Below are the broad categories of biases a modelling data can fall prey to:
- Sampling Bias: Occurs when the Data Subset is not Representative of the Population.
- Exclusion Bias: Occurs when features seemingly deemed irrelevant are removed prior to Model Building.
- Confounding Bias: Occurs due to confounders in the dataset (correlated variables with respect to both predictor and response)
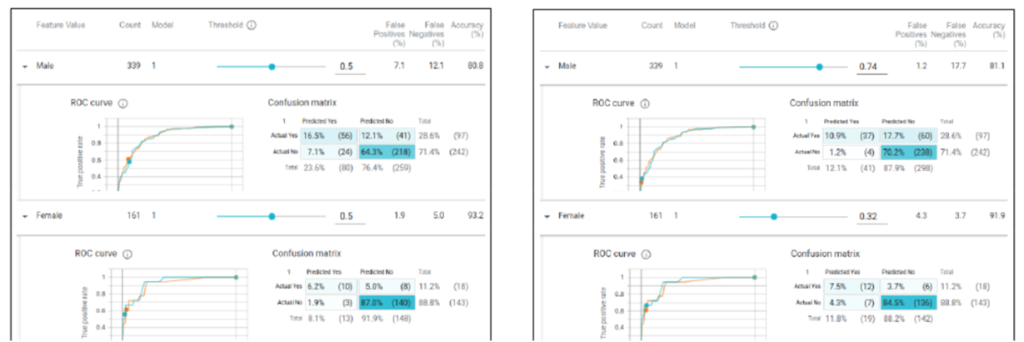
What-if Tool[3] is a great option to detect such biases through UI and threshold based options. Let’s take an example of income prediction, wherein a logistic regression model is trained on both sexes to predict their respective income as High or Low. Choosing the cut-off as 0.5 (>=0.5 – High Income) for both males and females result in 23.6% of males and only 8.1% of females getting classified as high income(As shown below in the left dashboard). This is a classic example of sampling bias wherein the large imbalance between working men and working women in the training data have resulted in men much more likely to be labelled as high income than women.
Using the What-if Tool, we can experiment with different cut-offs to arrive the optimal bias-free threshold. In our example, adjusting the thresholds (0.74 for men and 0.32 for women) results in a much more even distribution (12.1% for men and 11.8% for women) as can be seen on the right dashboard.
All such slice-and-dice on the data and parameters can be performed through sliders, clicks and drop-downs in the What-if Tool to help identify and alleviate these biases and ensure a fair modelling data.
Conclusion:
In this article, we talked about the different dimensions of Data Quality and process to automate the same from a Data Science Lens. A robust QC Process for Data Science will go a long way to ensure quality releases, reduce bugs and improve trust and confidence in the solution. Automation of the same would reduce the time spent in ensuring that the solution adheres to the Quality Standards.
References:
Title picture: freepik.com