
Rural Development: Leveraging Analytics to uplift base of the Pyramid
3AI November 19, 2020

The benefits of big data are not only transforming the businesses in the urban areas but also they can be equally extended to the rural parts of the country. The penetration of mobile phones and other connected devices generate huge amount of structured and un-structured data every day. Productivity in rural India is extremely low due to unscientific farming practices, fragmented land holdings, lack of agro-climatic focus for crops selection, lack of access to the right farming advice at the right time. While focus has been on improving farm production, reducing food supply-chain losses remains a relatively unaddressed problem. The rise of the middle class has also raised the expectations of citizens and businesses for higher standards of service as well as greater transparency and access to government leaders, policies, and operations. Continuing globalization is forcing Government to attract foreign investments for economic growth by improving government services to make India a desirable place for both businesses and individuals 1.The Government of India is taking steps, such as Unique Identity (UID) Project, rural employment poverty upliftment schemes and financial inclusion initiatives, poverty up liftment schemes and financial inclusion initiatives, to drive the overall development of the economy.
The push towards policy innovation and digital India through broadband highways will drive spend on analytics, Geographical Information System (GIS), risk management software, portfolio management, portal enhancements, web content management, and customer engagement solutions. The national e-Government plan has proposed setting up of 250,000 tele-centers in rural areas to provide public access to computers and online service delivery. Big data for development is about turning imperfect, complex, often unstructured data into actionable information. This implies leveraging advanced computational tools, and customer engagement solutions. The national e-Government plan has proposed setting up of 250,000 tele-centers in rural areas to provide public access to computers and online service delivery. e.g. UNICEF’s ‘Digital Drum’ allows populations in remote areas to seek answers on issues ranging from agriculture, health, and education to business advice and entertainment, providing a window on the interests and concerns of information seekers whose location, age and gender are generally recorded.
Data Integration
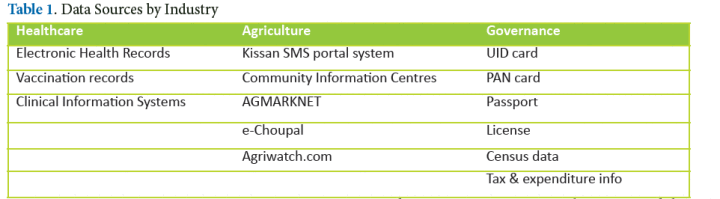
Whether reforming an individual sector or undertaking a city wide operational reform, the first step is to integrate processes and data across diverse sector infrastructure. e.g. Barcelona City Council created a comprehensive data warehouse gathering data from more than 20 heterogeneous source systems supporting the automation of more than 2,500 KPIs.The ‘traditional data’ (official statistics, survey data, etc.) will continue to generate relevant information, but the digital data revolution presents a tremendous opportunity to gain richer, deeper insights into human experience that can complement the development indicators that are already collected.e-Governance would imply that beneficiaries should progressively benefit from a legally binding fully electronic and paperless exchange with rural development bodies and national administrations at all levels. e-Governance would also require applying the ‘only once’ encoding principle, allowing beneficiaries to encode data only once – those data being shared between different administrations at national and regional level – using electronic online portal functionalities. At State level, e-Governance means that digital signature should be implemented effectively by electronic portals at national and regional level and that electronic storage features are made available in national systems used for dealing with rural development projects. Following are the list of top data sources:
New data sources for big data include industries that just recently began to digitize their content. In virtually all of these cases, data growth rates in the past five years have been almost infinite, since in most cases it started from zero. Industries include:
- . Media/entertainment: The media/entertainment industry moved to digital recording, production, and delivery in the past few years and is now collecting large amounts of rich content and user viewing behaviors.
- . Healthcare: The healthcare industry is quickly moving to Electronic Medical Records (EMR) and images, which it wants to use for short-term public health monitoring and long-term epidemiological research programs.
- . Video surveillance: Video surveillance is still transitioning from CCTV to IPTV cameras and recording systems that organizations want to analyze for behavioral patterns (security and service enhancement).
- Transportation, logistics, retail, utilities, and telecommunications: Sensor data is being generated at an accelerating rate from fleet GPS transceivers, RFID tag readers, smart meters, and cell phones (call and usage data records); that data is used to optimize operations and drive operational BI to realize immediate business opportunities. The complexity of handling this expanded universe of data sources is compounded by the need to link, match and transform data across business heterogeneous entities and systems, while managing scale and timeliness. The key to effective data-driven decision-making is the ability to sift through large amounts of data; and the ability to combine data from several sources to gain a more comprehensive view of the business. Seemingly unimportant data can become crucial once combined with other sources to reveal new insights.
Data Normalization
Part of the need for new technologies for big data (versus older, legacy Relational Database Management Systems) has to do with the format of the data coming in from various applications. Data quality is a big issue. A more dynamic, flexible database schema is needed to handle the structured, semi-structured, and unstructured data that comprises today’s big data. These database schemas need to be able to deal with a wide range of data formats since data formats density varies significantly across industries as shown below.
Big data for development generally share some or all of these features:
- . Digitally generated: data are created digitally (as opposed to being digitised manually), and can be stored using a series of ones and zeroes, and thus can be manipulated by computers.
- . Automatically collected:system automatically extracts and stores the relevant data as it is generated
- . Geographically or temporally traceable: e.g. mobile phone location data or call duration time
- . Continuously analysed: information is relevant and can be analysed in real-timeSince there is no ‘perfect’ data, a concept of ‘fit for use’ is applied keeping in mind the purpose of data. The potential of big data for development is best realised when its limitations, biases, and ultimately features, are adequately understood and taken into account when interpreting the data. Data must be able to comply with all the laws international, federal and state regulations, fiscal and monetary reporting statutes and all applicable civil rights laws, including privacy and security.
Metrics / Co-relation
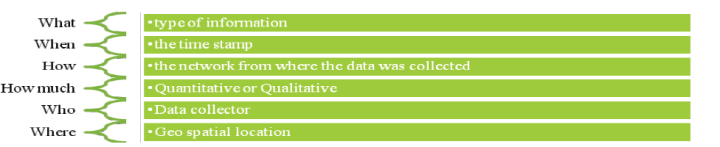
The first step is to connect data collected from a variety of sources: network and non-network, structured and unstructured. Unique data elements (metrics) for the subject areas viz. healthcare, governance, banking, agriculture should be identified. Analysis should be done on the overall availability and quality aspects of the identified fields. A common framework for information processing is defined to discover patterns and trends in the data. A common reference guide is required that will help tag data with following parameters in Figure:
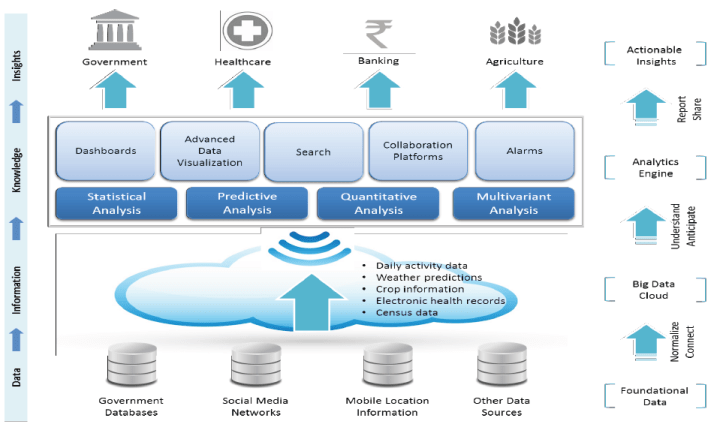
Rural Data & The Integrated Analytics Approach
Such exceedingly large data volumes cannot be analysed with ordinary assessment methods, such as sampling or simple spreadsheets. They typically rely on advanced visualization techniques and powerful algorithms. Algorithms are able to detect patterns, trends, and correlations over various time horizons in the data and can help in detecting anomalies in the form of large deviations from the expected trends or relations in the data. Visualisation tools can provide new perspectives on findings that would otherwise be difficult to realise.Biggest power of data analytics is the predictive capability that can help to determine reliable patterns and forecast what might happen in the future. e.g. When predictive analysis is applied to public health, online data has been used as part of syndromic surveillance efforts. According to the US Center for Disease Control and Prevention (CDC), mining vast quantities of health-related online data can help detect disease outbreaks ‘before confirmed diagnoses or laboratory confirmation’ 27.With improved real-time connectivity and data management arise the possibility to create tailored data sets, readily available for analysis. This would be the core ingredient in data-driven efficiency improvements in a number of sectors – for example, transport, logistics, energy, agriculture and environmental protection. Turning big data into actionable information requires using computational techniques to unveil trends and patterns within and between these extremely large socioeconomic datasets.It is important to shift from analytics application silos to more generic, horizontal analytics environments that take in a wide array of data sources, while supporting a variety of applications and services.
Conceptual framework for Rural Development
Cutting-edge IT components like data storage, data management and network resources can work in harmony with domain- specific analytic logic (data models, rules sets, and so on) to bring benefits in terms of agility and scalability. e.g. Indian Agricultural Statistical Research Institute has developed a Decision Support System on nutrient management in crops. Under the e-Governance programme, Soil Health Card software has been standardized and in collaboration with Indian Institute of Soil Science, Bhopal, web-based software has been developed to provide integrated nutrient management recommendations using ‘Soil Test Crop Response’ method for 8 states. Analytics to be fully effective can be automated and run at regularly scheduled intervals, which enables immediate identification of potential high-risk exception transactions in real-time.Furthermore, informed and effective evidence-based decision-making in business and society would be facilitated by access to insights based on analysis and interpretation of more accurate and up-todate data. Leveraging big data can reduce time lag and human inputs/errors in data collection, production and transmission.