
Understanding Language Model Evaluation Metrics: A Comprehensive Overview
3AI October 20, 2023

Featured Article:
Author: Mradul Jain, AB InBev
Large language models, such as GPT, Llama, Bard, etc. have gained immense popularity for their ability to generate coherent and contextually relevant text. Evaluating the performance of these models is crucial to ensure their reliability and utility. To accomplish this, a range of metrics have been developed. In this article, we will explore various metrics commonly used to assess the performance of language models. We will delve into their strengths, drawbacks, and how they complement each other to provide a holistic view of a model’s capabilities.
Perplexity:
Perplexity quantifies how well the model predicts a given sample of text, indicating the degree of uncertainty or surprise in the model’s predictions. In essence, perplexity is a way of assessing how well a language model assigns probabilities to a sequence of words.
Mathematically, perplexity is defined as the exponentiated average negative log-likelihood of a sequence. A perplexity of 1 means the model predicts the words near perfectly, while higher perplexity values indicate more uncertainty and poorer performance. It is calculated using the following formula:
Perplexity(W) = 2^H(W)
Where:
- Perplexity(W) is the perplexity of a sequence of words W.
- H(W) is the entropy of the word sequence W. Entropy measures the uncertainty or randomness in the language model’s predictions for the next word.
The entropy H(W) is calculated as:
H(W) = – (1 / N) * Σ[log2(P(wi | w1, w2, …, wi-1))]
Where:
- N is the number of words in the sequence W.
- P(wi | w1, w2, …, wi-1) is the conditional probability of the word wi given the preceding words w1, w2, …, wi-1.
Let’s take an example,
Sentence : “I am Learning”
- Calculate the conditional probabilities for each word given the previous words:
- P(“I” | Start of Sentence) = 0.3
- P(“am” | “I”) = 0.5
- P(“learning” | “I am”) = 0.4
- Calculate the entropy for the sentence: H(W) = – (1 / 3) * [log2(0.3) + log2(0.5) + log2(0.4)]
- Calculate perplexity: Perplexity(W) = 2^H(W) = 2^(- (1 / 3) * [log2(0.3) + log2(0.5) + log2(0.4)]) = ~ 2.55
Human Evaluation: The Gold Standard
Human evaluation remains the gold standard for assessing the quality of language models. It encompasses multiple aspects, including Relevance, Fluency, Coherence, and Overall Quality. These criteria are subjective and rely on human judgment, making them highly reliable. However, human evaluation can be time-consuming, expensive, and may involve biases.
Relevance measures how well the generated text aligns with the given context or prompt.
Fluency assesses the naturalness and smoothness of the generated text.
Coherence evaluates the logical flow and consistency of ideas in the text.
Overall quality combines all these aspects to provide an overall assessment of the generated content.
BLEU (Bilingual Evaluation Understudy): Assessing N-gram Overlap
BLEU is a metric used to evaluate the quality of machine translations by comparing them to human reference translations. It quantifies the similarity between the machine-generated text and the reference text, with higher BLEU scores indicating better translations.
BLEU is computed using two main components: precision and a brevity penalty.
Precision:
Precision = (Number of overlapping words in the machine translation and reference) / (Number of words in the machine translation)
In this formula, “overlapping words” refers to words that appear both in the machine translation and in the reference. Precision measures how many of the machine-generated words are also present in the reference.
Brevity Penalty:
To encourage longer translations, a brevity penalty is applied. It penalizes translations that are significantly shorter than the reference translation.
Brevity Penalty = 1 (if machine translation length >= reference length)
Brevity Penalty = e^(1 – (reference length / machine translation length)) (if machine translation length < reference length)
BLEU Score:
BLEU = Precision * exp(Brevity Penalty)
Let’s calculate the BLEU score for a machine translation of the,
Reference translation: “A fast brown fox leaps over the lethargic dog.”
Machine translation: “The speedy brown fox jumps over the lazy dog.”
Precision:
Number of overlapping words = 7 (brown, fox, jumps, over, the, lazy, dog)
Number of words in the machine translation = 7
Precision = 7/7 = 1.0
Brevity Penalty:
Reference length = 8 words
Machine translation length = 7 words
Brevity Penalty = exp(1 – (8/7)) ≈ 0.88
BLEU Score:
BLEU = Precision * Brevity Penalty = 1.0 * 0.88 ≈ 0.88
While BLEU is straightforward and computationally efficient, it has limitations. It doesn’t account for semantic or contextual understanding and can favor longer, repetitive output.
ROUGE (Recall-Oriented Understudy for Gisting Evaluation):
ROUGE is another metric used in the evaluation of text generation models. It assesses the overlap of n-grams, word sequences, and phrases between the generated text and reference text. ROUGE captures more nuanced content overlap than BLEU, making it suitable for tasks like text summarization and machine translation. However, like BLEU, it may not fully capture semantic nuances.
Let’s understand these metrics in more detail
ROUGE-N: N-gram Overlap
ROUGE-N = (Count of overlapping n-grams in reference and generated text) / (Total number of n-grams in the reference)
Reference sentence: “The quick brown fox jumps over the lazy dog.”
Generated sentence: “A fast brown fox jumps over a sleeping dog.”
For ROUGE-1 (unigrams), the overlap is 6 (brown, fox, jumps, over, the, dog) out of 10 total unigrams in the reference. So, ROUGE-1 = 6/10 = 0.6.
Use ROUGE-N when you want to assess the precision and recall of specific n-grams. It’s suitable for tasks where exact wording is crucial, like machine translation or text summarization.
ROUGE-L: Longest Common Subsequence
ROUGE-L = (Length of the LCS) / (Length of the reference)
Choose ROUGE-L when you need to measure the preservation of the word order. It’s beneficial for tasks like text summarization and document alignment.
Consider above reference and generated sentence,
The LCS between these sentences is “brown fox jumps over dog,” which has a length of 5 words. The reference length is 9 words. So, ROUGE-L = 5/9 ≈ 0.5556.
ROUGE-S: Skip-Bigram Co-occurrence
ROUGE-S = (Count of co-occurring skip-bigrams in reference and generated text) / (Total number of skip-bigrams in the reference)
Consider above reference and generated sentence,
For ROUGE-S, you’d consider pairs of words like “quick brown,” “fox jumps,” “over the,” “the lazy,” “lazy dog.” If you find 4 skip-bigrams in common, and if there are 9 skip-bigrams in the reference, ROUGE-S = 4/9 ≈ 0.4444.
Use ROUGE-S when you need to evaluate the co-occurrence of words with some flexibility. It’s suitable for tasks where context and syntax are vital, like sentence alignment.
BERTScore: Leveraging Pre-trained Models
BERTScore is an evaluation metric that utilizes pre-trained contextual embeddings from models like BERT. It measures the similarity of word embeddings between the generated text and reference text. BERTScore has the advantage of considering semantic similarity, making it a valuable addition to traditional metrics. Nonetheless, it may still miss aspects of relevance and coherence, especially when the generated text deviates from the reference text in structure or style.
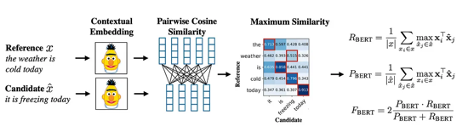
The architecture consists of the following steps:
1. Token representation: Both the reference and candidate sentences are represented using contextual embeddings from BERT. This is done by passing the sentences through the BERT model and extracting the hidden state representations for each token.
2. Cosine similarity: Pairwise cosine similarity between each token in the reference sentence and each token in the candidate sentence is computed. This is done by calculating the dot product of the two token vectors and dividing by the product of their magnitudes.
3. BERTScore calculation: Each token in the reference sentence is matched to the most similar token in the candidate sentence, and vice versa. The precision and recall are then computed based on the number of matched tokens. The F1 score is then calculated from the precision and recall using the standard formula.
BERTScore calculation:
To calculate BERTScore, we first need to match each token in the reference sentence to the most similar token in the candidate sentence, and vice versa. This can be done by finding the token with the highest cosine similarity score. Once we have matched the tokens, we can compute the precision and recall as follows:
precision = number_of_matched_tokens / total_number_of_reference_tokens
recall = number_of_matched_tokens / total_number_of_candidate_tokens
The F1 score is then calculated from the precision and recall using the standard formula:
f1_score = 2 * precision * recall / (precision + recall)
The F1 score is a balanced measure of precision and recall, and it is the metric that is typically reported when evaluating BERTScore.
MoverScore: Measuring Semantic Similarity
MoverScore is a relatively recent addition to the evaluation toolkit. It is based on the Earth Mover’s Distance (EMD), which is a metric for measuring the distance between two probability distributions. The EMD is calculated by finding the minimum amount of work required to transform one distribution into the other, where the work is defined as the cost of moving a unit of mass from one point to another. However, it is computationally expensive and might not fully address issues related to fluency and coherence.
To calculate MoverScore, we first represent the reference and candidate sentences using contextual embeddings from a pretrained language model, such as BERT. We then use the EMD to measure the distance between the two probability distributions of the contextual embeddings. The MoverScore is then defined as the inverse of the EMD, so that higher scores indicate more similar sentences.
It is a value between 0 and 1, with a higher score indicating greater similarity.
MoverScore(ref, cand) = 1 / EMD(ref, cand)
The EMD is defined as follows:
EMD(P(ref), Q(cand)) = ΣΣ f(i, j) * D(i, j)
Where:
• EMD(P, Q) is the Earth Mover’s Distance between distributions P and Q.
• f(i, j) represents the flow of earth from bin i in distribution P to bin j in distribution Q.
• D(i, j) is the cost of moving earth from bin i to bin j.
While these metrics provide valuable insights into the performance of language models, it’s crucial to recognize their limitations. Perplexity mainly gauges fluency and predictability but not relevance or coherence. Human evaluation, while comprehensive, is resource-intensive and subject to human bias. BLEU and ROUGE focus on surface-level text overlap and may not capture semantic nuances. BERTScore and MoverScore introduce semantic understanding but may not fully address fluency and coherence.
Evaluating the performance of large language models is a complex task that requires a multi-faceted approach. Each metric has its strengths and weaknesses, and by using them in tandem, we can gain a more comprehensive understanding of a model’s capabilities.
Title picture: freepik.com