
P&L Forecasting Enabled by Analytics
3AI August 10, 2022

Author: Rajagopal Rangarajan, Senior Manager – Analytics, AB InBev
Accurate P&L forecasts help companies build a good financial plan for the year. It enables the financial planning team in allocating resources more meaningfully across the company. For large and highly leveraged companies like AB-InBev with annual Revenues more than $50 Bn and with a debt close to $100 Bn, accurate P&L projections are the difference between increasing investments, reducing debt or taking on more debt. In 2019 the Forecasting Team, part of the Growth Analytics Center (GAC), the Global Analytics Hub for AB-InBev was tasked with building accurate P&L forecasts from Volumes until Marginal Contribution (MACO) and later extend it to EBITDA. Global FP&A targeted the Forecasting team with reducing MACO forecasting dispersion to less than 2.5%. Since then, the GAC Forecasting Team regularly delivers P&L forecasts for the entire company (around 125 Country-Beverage category combinations) every month for the rest of the year and the next financial year. In 2020 and 2021 the team was successful in reducing MACO dispersion to less than 1.6% globally.
What do we forecast?
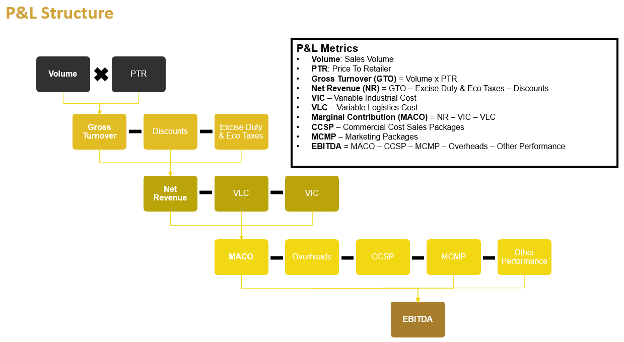
We started by forecasting the P&L lines from Volumes until MACO, where Volumes, GTO, Discounts and Excise Duty, VIC and VLC were forecasted while Net Revenue (NR) and MACO were calculated from the other forecasted lines.
Top line (NR) is driven by
- Total Volume sold (in HL)
- Price/HL
- Discounts given to customers
- Excise/Eco taxes paid to governments.
The bottom line (MACO) is driven by the
- Variable Industrial Costs (VIC) coming from cost of procurement, production and packaging
- Variable Logistics Costs (VLC) from transport and logistics costs.
The previous process involved the Global FP&A team collecting the Latest Estimates (LE’s) in P&L from all the 6 Zones who in turn would have collected the projections from all the Business units (BU’s) within the zones. In most cases these projections were based on the gut-feel of the Commercial/Finance teams within the BU’s with little to no statistical rigor.
Our goal was to build robust statistical forecasts for all the P&L lines for all countries-categories using cutting edge machine learning models.
How did we approach the problem?
CENTRALIZING DATA
Different sources of data were available at various granularities and frequencies ranging from Country level P&L data available monthly to Volumes which were available daily, to granular P&L data available at Region-Channel-SKU level at a monthly frequency. The platforms of data availability also varied from SAP systems, databases like Vertica to flat excel files and PowerBI dashboards.
We worked to centralize all the available data into our internal Data Lake (BrewDat) building a regular automated cadence for data ingestion and reconciliation from the various sources.
MODEL BUILDING WITH BUSINESS INPUTS AND ASSUMPTIONS
We start with the first P&L line which is Volume. Our volume forecast model for the year to go and next year is a multivariate ensemble model of the following:
- Top-Down country level model at a monthly frequency
- Daily Sales model at a country level daily frequency
- Granular forecast at Region-Channel-SKU level monthly frequency where available
It was important that we forecast volumes not only at the country level but also granular because the volume mix projections impact Net Revenue as well as VIC and VLC which eventually allows us to have a better forecast of MACO
Some of the drivers and business inputs that are part of the volume models include:
- Macroeconomic indicators
- Weather drivers
- Demographics
- COVID Impact: During the time of lockdowns due to COVID across countries, we used various factors like COVID case-loads, deaths, vaccination rates, Government Stringency indices etc and modeled potential government actions using epidemiological models
- Price (both at country level as well as granular level) and planned Price changes
- Business decisions/inputs like inventory levels, production capacities and distribution capacities
Once we arrive at our volume forecast, we proceed to forecast other P&Ls. For the other non-calculated P&L lines like GTO, Discounts, Excise/Eco tax and VIC/VLC we forecast the perHL for each line and from our Volume forecast we arrive at the P&L forecasts and ultimately calculate Net Revenue and MACO. Like Volumes the other P&L lines are also forecasted at both the country level and the more granular level (Region-Channel-SKU) where data is available.
Some of the drivers and business inputs here include
- Planned price increases
- Commodity prices
- Energy/Fuel prices
- Inflation
More recently the team has also started forecasting P&L lines below MACO until EBITDA using the same principles as P&L lines above MACO and started delivering forecasts until EBITDA every month.
FORECAST CONSUMPTION
GAC P&L forecasts at both the country level and granular level are consumed by stakeholders including Zone Commercial/FP&A, Global Commercial/FP&A teams and Senior leadership including the CEO, CSO and CFO through our PowerBI dashboards and Anaplan.
What’s next in P&L Forecasting?
RANGE FORECASTS
From delivering only point forecasts the team is moving towards delivering dynamic range forecasts for Volume, Net Revenue and MACO. We are building these range forecasts to enable better strategic decision making by senior leaders within the planning functions as having a statistical range for the P&Ls can help identify possible risks and opportunities to the business due to uncertainties and volatilities in the market.
FORECASTING PRODUCT
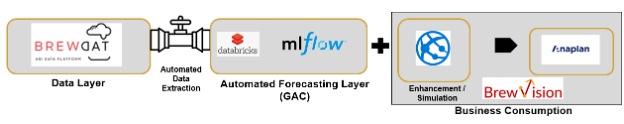
Our in-house Forecasting Product called BrewVision is a work in progress. This Product/tool will help democratize the forecasting process and it’s use in the various planning functions within the organization. Key features of BrewVision includes:
- Automated data extraction from the in-house Data-Lake (BrewDat)
- Scheduled and automated model runs to generate baseline P&L forecasts using an Azure Cloud platform
- Business enhancement layer to enable manual enrichment of the statistical forecasts to capture local business intelligence and decisions which cannot be captured in the form of data
- Dashboard to view forecasts at both country level as well as the granular level
- Interactive simulator tool to enable stakeholders to build their own scenarios based on the drivers and business inputs (like Price/Price increase calendar) and simulate the outcome on the P&L forecasts. This enables the democratization of forecasting and at the same time enables stakeholders to understand the impacts of their business actions better and more accurately
- Deliver better data driven investments decisions across the company
SUMMARY
As a mature capability within GAC that has already driven accurate P&L forecasts with a MACO dispersion less than 1.6% over the past few years. In FY21’ accurate projections of the company’s financials enabled AB-InBev to reduce its debt by almost $10 Bn. The expansion of P&L forecasting capability by adding range forecasts and the forecasting product BrewVision will enable better strategic decision by leveraging cutting edge ML models while at the same time the simulator will enable business planners to plan scenarios, challenge the statistical outlook from the models and use the granular forecasts for improved resource allocation across countries/brands.
Title picture source: freepik.com